RootflowRT v.2.8
About
RootflowRT v.2.8
The
Software
Dr
H Jiang and Dr K Palaniappian
created RootflowRT at the University of Missouri-Columbia, in
collaboration with Dr T Baskin. W Sulaman implemented
the graphical user interface while at the
The
software was designed to estimate spatial velocity profiles for growing roots
of Arabidopsis thaliana at high spatial resolution. The images of roots
that are best suited for analysis are those with clear focus throughout the
growing root and the root"s midline is parallel to the horizontal axis of the image frame. Roots that
are very curved and undulate in and out of the focal
plane are not suitable for analysis.
Input
Image Requirements
Images
should be in .tif or .ppm
format, contain 8-bit gray scale values and 640x480up to 1200x1600 in
dimension. Roots are imaged as overlapping stacks throughout the tip to the
maturation zone or as a single stack of just one region such as the root
tip. Overlapping between stacks
should be at least 20% of the field of view. Each root segment stack must be imaged 9
times taken over precise time intervals. Each of these 9 images is a frame in
the stack.
Input
Image File Names
The
software expects the image files to be named according to precise conventions.
In particular, the images should be named Stack00xxFrame00yy with or without
filename extension such as .tif or .pgm. For example, a root may be imaged with 5 overlapping
stacks with frames taken every 15s. In this case, the image files can be:
Stack0001Frame0001.tif
Stack0001Frame0002.tif
.
.
Stack0003Frame0001.tif
.
.
Stack0005Frame0009.tif
Mosaic
Method Between Overlapping Stacks
This
refers to the process of blending together the velocity profiles of each of the
individual stacks into one complete velocity profile for the entire root. There
are two ways this can be executed, 1) Moving a precise fixed distance between
every stack or; 2) Taking a highly textured image of the background after the 9thframe
and naming it Stack00xxBack0001 eg.Stack0006Back0001.tif.
Input
Files
For
each root a specially formatted input file is required that can be generated
manually or with the Make Input File menu option. It should be located in the
working directory.
Output
Files Produced after Successful Analysis
After
a successful analysis, several files will be output to the working directory.
There should be diameterprune_xx.tif and pointsfitline_xx.tif files for each stack. These can be
examined for quality and accuracy.
The
last line of the input.txt file specifies the names of two key output files.
They contain the numeric velocity data from the tensor only and robust-tensor
methods. For example, Control_root2.txt and Control_root2_tensorresult.txt may be two
output files that result.
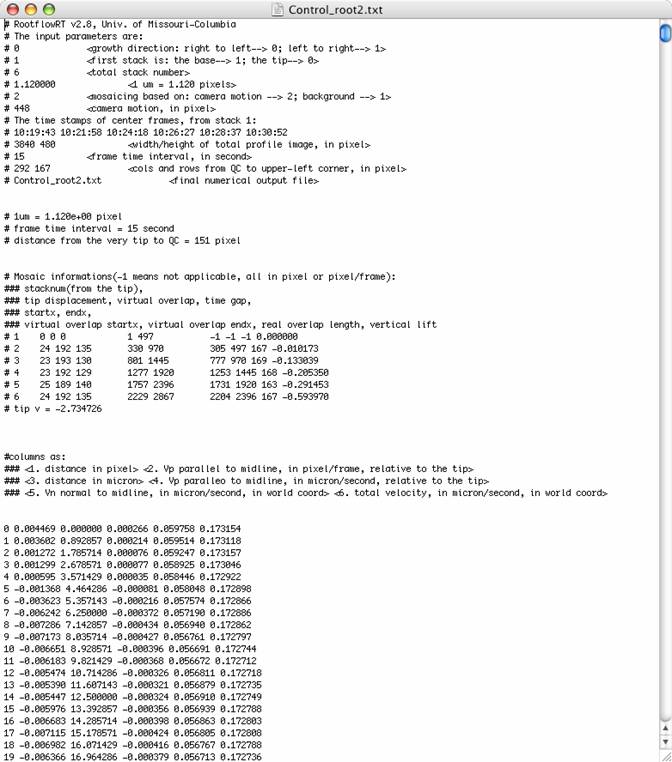
The
end of the output files, contain columns in three pairs. These are the
resulting velocities and can be graphed by importing this as a space-delimited file
into Microsoft Excel. More
information about these columns is present in the output file. The first pair
represents the pixel distance from the quiescent center and the corresponding
velocity at that point in pixels/frame. The second pair represents the micron
distance from the QC and the corresponding velocity in microns/second.