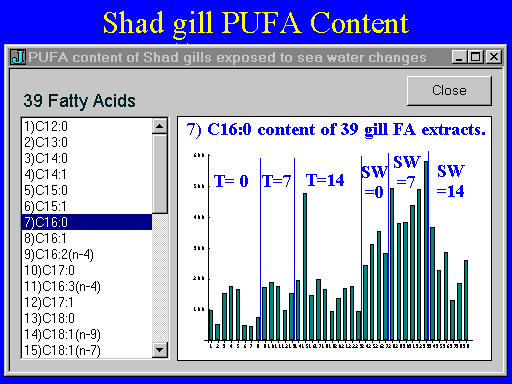
| Figure 1. Illustration of the J bar chart utility which allows demonstrating the FA content of 39 samples. This instance shows the relative C16:1 content of the 39 shad samples from an experiment with 6 treatments in which the shad were exposed to various times in fresh or sea water (SW). |
 |