Description of O2-electrode reaction
Sampling rule: O2
3D-ion Sampling Rules
| PointName |
|
|
|
|
|
|
| Origin |
|
|
|
|
|
|
| X |
|
|
|
|
|
|
| Y |
|
|
|
|
|
|
| Z |
|
|
|
|
|
|
Probe: O2 3D-gradient raw output:
The output is presumably a nitrogen bubble O2 sink. It could be better represented as a mage file.
Here is a contour plot of uVtotal, uVx, uVy, and uVz for the sink scan:
Kinemage stereo-image of nitrogen bubble O2 sink:
O2-sink Kinemage File:
View the kinemage of the nitrogen bubble O2 sink.
Here is how the outlines of pollen tubes were obtained using tpsDig software by F. James Rohlf. The tpsDig software allows X Y coordinates to be saved associated with the picture name in a text file with '.tps' suffix. On the probe data side, the um X, Y and Z position of the probe is automaticly saved with the picture grabed by ASET and presented in the data output file. We then are able to correlate the tps pixel coordinates with ASET probe coordinates in several pictures such that we can establish regression equations relating pixel coordonates to um coordinates. Any translations of the field of view of the specimen that are needed, due to growth, are able to be corrected within a spreadsheet environment. Care is taken when moving the specimen to translate and not rotate the subject, which makes the coordinate corrections simpler.
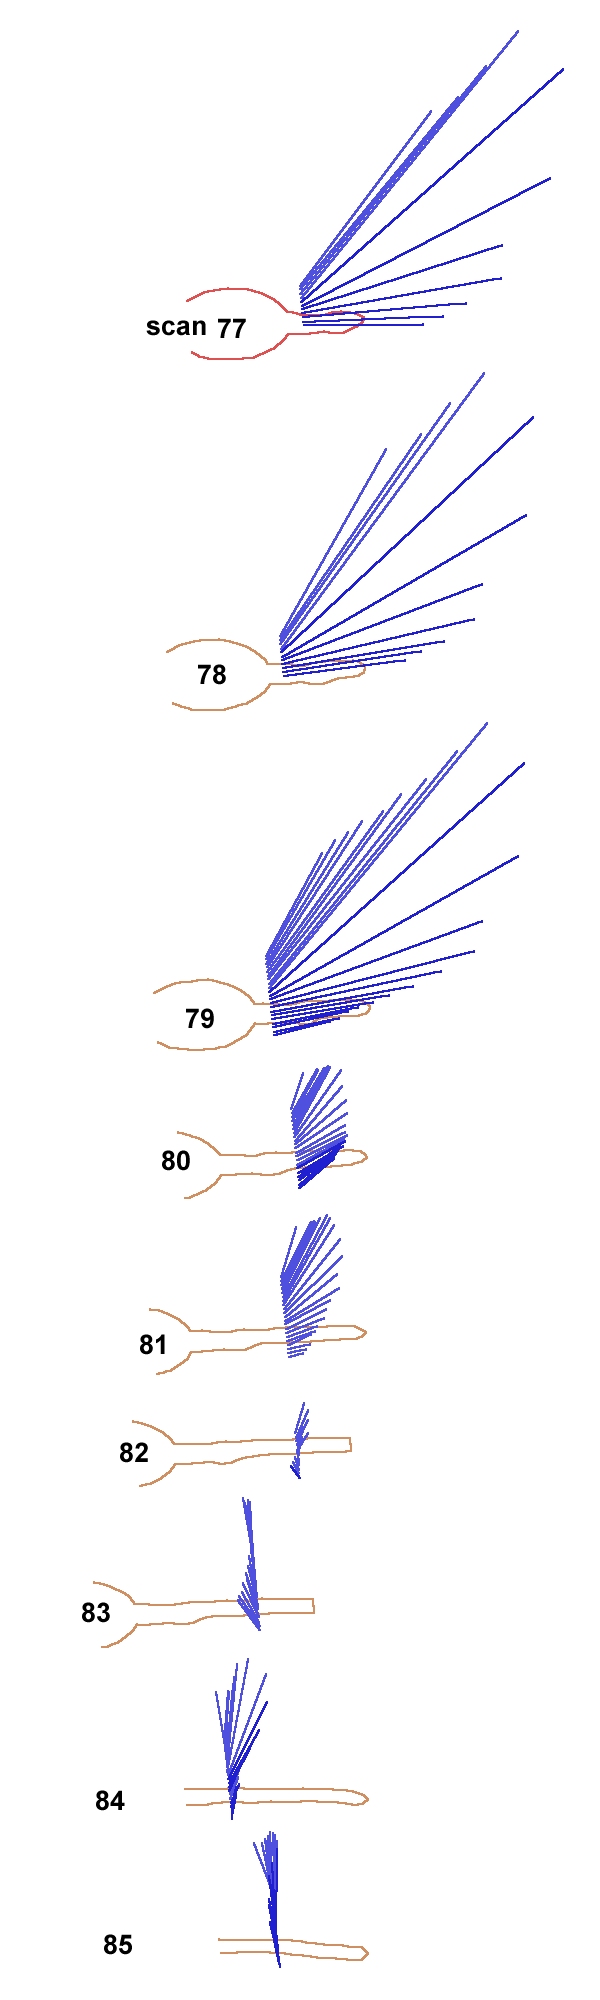
Here is a montage plot of individual pollen tube scans 77-85: