The purpose of the present Planning Assignment is for you to choose combinations of antibodies and cells, and predict what you will see, based on your previous training in immunology and on the Background Information provided below. This will help prepare you to understand what you will be doing in the lab, and the results you obtain. Of course it will be helpful to review relevant topics in your favorite immunology textbook.
After your Plan is handed in, you will prepare a sample of cells stained with fluorescent antibodies, and obtain the results from the flow cytometer. You will be assigned combinations of antibodies and cells to do. In order to have the class cover all possibilities with little or no duplication, you may or may not be assigned the combinations you proposed in your plan. After all samples are analyzed, the results will be made available to the entire class. In order to interpret your own results fully, you will need to compare results from your samples with other samples prepared by other students. Your results and comparisions will be written up in your Flow Cytometry Lab Report, which will be due later, after you have obtained your results and analyzed them.
Each student will prepare one sample. Each sample will consist of cells (either splenocytes or thymocytes) stained with two antibodies to leukocyte surface markers (receptors). The antibodies will be detected by fluorescence (either direct or indirect). One will be detected with green fluorescence, and the other with red fluorescence. Your two antibodies should be selected from the tabular list entitled Antibodies available (included, also on-line).
The complete flow cytometry (FC) experiment is explained in a separate and later section (Flow cytofluorometric analysis of mouse lymphocyte subpopulations).
Format and Contents of Your Plan.
Your Plan is a required assignment and must be handed in by the due date for grading. It is worth 10% of your semester grade.
Please note that your Plan is not a "lab report". A "lab report" summarizes data obtained and your interpretation of them. Since you don't have your data yet, your Plan does not need the organization of a lab report. It does not need an abstract, introduction, methods, results, or discussion. Otherwise, however, it should follow the Guidelines for Writing Assignments in the Immunology Lab Policies near the beginning of this manual.
Your plan should have the sections listed below in the order below:
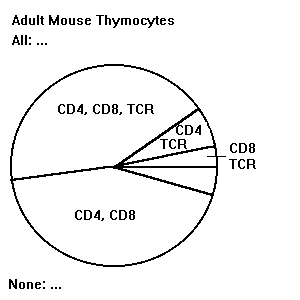
Thymocyte Pie Chart.

The purpose of this planning assignment is to prepare you better to be able to interpret your results. The pie charts will help you become familiar with the distributions, in splenocytes and thymocytes, of the receptors detected by the available antibodies.
The goal of your pie charts is to make the simplest, clearest possible representation of the distributions of the available antibody specifities on the cells. This thymocyte pie chart is based on one in the 2nd edition of Cellular and Molecular Immunology (Abbas et al.). Copy it (neat freehand drawing is fine). The sizes of the "slices" represent approximately the percentages of cells of each type. (Don't write in numeric percentages for cells falling in each slice.)
Consult the table of Antibodies Available, and label your thymocyte pie chart with all of, and only, the available specifities listed in that table. (For example, since CD3 is not available, don't put it on your chart even though it is an important marker.) When adding an antibody to your chart, always write the specifities (not antibody numbers). (If there are multiple antibodies available for one specificity, write the specificity only once.) The Background section below provides essential information. For specifities expressed on subpopulations of cells, write the specifities on (or next to) the appropriate segment(s), as shown on the example pie chart. For specifities expressed on all cells, list the specifities above the top and outside of the pie (after All:). Don't repeat them in each segment! For specifities expressed on none of the cells, list the specifities below and outside of the pie (after None:). After you copy the thymocyte pie chart shown here, it is your responsibility to add any of the available antibody specifities that are not already on the pie chart!
Splenocyte Pie Chart.
Construct a second pie chart for splenocytes (note the correct spelling -- it is not spleenocytes). See below for information about the sizes you should make each segment. Label each segment with the cell type as well as with the specifities it expresses. For example, you know that all virgin B cells express IgM on their membranes. Thus, label the B cell segment of your chart with IgM. Continue this process until all the antibody specificities available to you in this lab are accounted for.
Combinations & Predictions.
Select a combination of one cell type plus two antibody specificities that you would like to prepare in the laboratory. By a "combination" or "sample" is meant a test that will be mixed in a single test tube for later analysis on the flow cytometer. Only antibodies that are listed as "available" can be used! You must select one green (fluorescein-conjugated or indirectly reported) antibody, and one red (phycoerythrin-conjugated) antibody. Only two types of cell suspensions will be available, splenocytes and thymocytes (choose one for each sample). Refer to antibodies by specificity, not by number. List all antibodies you will apply to the cells, including antibodies needed for indirect staining.
Explain what percentage of the cells you expect to be positive and why. Sketch the two histograms you predict/expect (one for green, one for red fluorescence). Show control (unstained) peaks as dotted lines on all histograms! Label all axes with fluorescence color, dimensions/units and antibody specificities, for example, "Green fluorescence intensity, Thy-1". Sketch the expected 2-color dot plot. Show a dot plot for unstained control cells, for comparision. Assume all histograms and dot plots have been properly scatter-gated, and therefore include only single, viable cells.
|
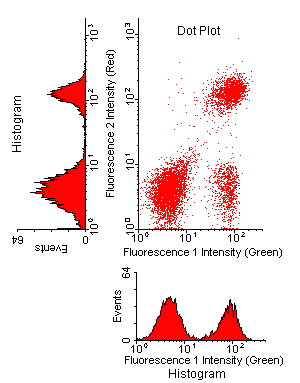
This figure
shows the relationships
between histograms (one color each)
and a two-color dotplot.
Notice that one peak in each histogram contains two subpopulations that are resolved in the dotplot. The existence of the cloud in the lower right quadrant cannot be appreciated from either histogram. Normally, the red-fluorescence histogram should be shown rotated 90 degrees clockwise, like the green-fluorescence histogram. It was rotated here to show how it relates to the events in the dot plot. The specifities have been left unlabeled here intentionally. Be sure to label the axes on your graphs with antibody specifities! |

|
Decide what other combinations of cells and antibodies are needed for comparison with the one you selected. Comparisons can verify the interpretation you will need to make, and reveal whether your results are consistent with those from other specifities. For example, you will want to compare your sample with two other samples, each stained with one color of antibody alone, to check for consistency. If one of your antibodies is a T cell marker, you'll want to compare with both T and B cell markers. List samples done by others you would like to compare with your own in order to reach a full interpretation, and explain briefly what each comparison will tell you. You should compare the expected results of your sample with results from at least six other samples.
In the actual laboratory, you will be assigned a combination that may be different than the one you discussed in your plan. Combinations will be assigned to guarantee good coverage of the possibilities by the class.
A course in immunology is a prerequisite for Micbio 542. Consult your textbook to review relevant concepts. Some key concepts are summarized very briefly here, along with some key facts that will help you to construct your splenocyte pie chart.
The thymus is a primary lymphoid organ. Pro-thymocytes that arise in the bone marrow migrate in the blood to the thymus. They mature into immunocompetent T lymphocytes in the thymus. Two important steps in T lymphocyte maturation are producing a unique T cell receptor (TCR) for antigen, and deletion of auto-reactive T lymphocytes. Each cell expresses both CD4 and CD8 before it produces its TCR. Later it expresses only one of CD4 or CD8, according to which class of MHC works best at presenting antigenic peptides to the TCR.
After they mature, T lymphocytes leave the thymus and travel via the blood to secondary lymphoid organs, namely the lymph nodes, spleen, and mucosa-associated lymphoid tissue. Secondary lymphoid tissues are where immune responses to antigen develop. Immune responses do not occur in the thymus because it contains largely immature T lymphocytes. Secondary lymphoid tissues include both B and T lymphocytes, and both CD4 (Th) and CD8 (Tc) T cells.
T cells need MHC in order to "see" antigen. A peptide fragment of a protein antigen is held in the groove of an MHC molecule and presented to T cells. Tc cells (CD8) look for intracellular parasites such as viruses, and require MHC class I. Because intracellular parasites can infect any type of cell in the body, all cells must express MHC I, although many express low levels that increase in response to infammatory cytokines. MHC class II is expressed only by professional antigen presenting cells, such as dendritic cells, macrophages, and B lymphocytes.
Think of the cells that can be suspended from the spleen or thymus as 100% lymphocytes. The cells of the connective tissue, capsule, endothelium, muscle, etc. that hold these organs together remain adherant to each other and do not "fall out" as single cells when the organ is shredded. During preparation of the cells, adherant clumps of cells are filtered out and discarded when the cell suspension is passed through a fine cloth (nylon monofilament fabric with holes about 100 micrometers in diameter). Although there are significant numbers of macrophages, dendritic cells, and in the thymus, specialized epithelial cells, these are also "sticky" cells that contribute few cells (typically less than 5%) to the final preparation. A large number of red blood cells falls out of the spleen; these will be removed by a density gradient centrifugation step before the lymphocytes are provided to you. Neutrophils and other granulocytes are rare in these cell populations; they are denser than mononuclear cells and will be removed by the same step that removes the erythrocytes.
Think about the lymphocyte subpopulations in the spleen and thymus, and their relations to each other. Is the spleen a primary or secondary lymphoid organ? Which is the thymus? What are the immunological functions of these organs? Can immune responses occur within both types of organs? What does the function of the organ tell you about the kinds of lymphocytes inside it?
In order for a full range of immune responses to occur, a secondary organ must include both B and T cells. Note that each cell must be one or the other; no cell is both B and T. Thus, B and T cells are exclusive subpopulations. Mouse spleen lymphocytes are approximately half B cells and half T cells. NK cells are typically less than 5% of splenocytes and are not distinguishable with the antibodies available.
To simplify your analysis you may assume that all the B cells will be virgin (therefore IgM positive); memory cells and plasma cells are in fact rare among the suspended cells you will receive. The thymus proper contains no B cells. About 85% of the lymphocytes in the thymus are immature (not yet immunocompetent) T cells. You may assume that about 2/3 of splenic T cells are CD4+, and 1/3 CD8+. TCR(gamma)(delta) cells are rare in the spleen and can be ignored in your analysis. All thymocytes and peripheral T cells express Thy-1 in the mouse. (The function of Thy-1 is unknown.)
Although the thymus tissue proper contains no B cells, will the cell preparation prepared from the thymus contain B cells? Think about possible sources of contamination with non-thymic cells during the process of harvesting from the mouse. Remember the result of injection of india ink into the peritoneal cavity of mice! (Hint: the mouse from which the thymus will be harvested for the flow cytometry exercise will not have been injected with india ink.)
Several of the antibodies provided for this exercise will label 100% of lymphocytes (including LFA-1 = CD11a, CD18, CD45, and ICAM-1). However, the results with these antibodies will not be as boring as you might expect. In some cases different lymphocyte subpopulations express different amounts of such markers per cell. Thus, there will often be two or more peaks differing in fluorescence intensities. In the lab, how can you tell which peak corresponds to B or T cells?
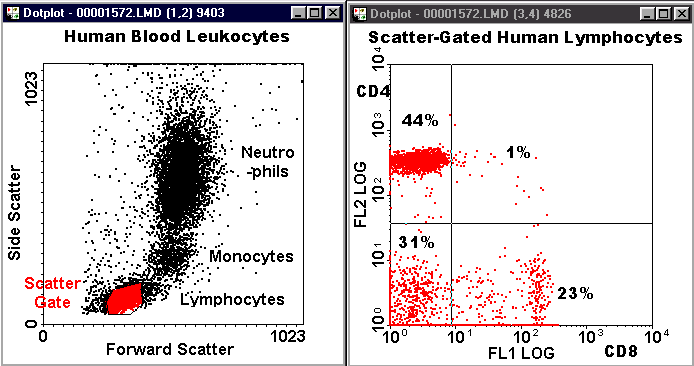
Phycoerythrin-conjugated (PE) antibodies emit red light. The FACScan quantitates red PE fluorescence in a separate channel (FL2) from green FITC fluorescence (FL1). Thus, if you use a red plus a green antibody on the same sample, you can distinguish which cells are stained by which antibody. This will allow you to find exactly what percentages of the cells are: double negative; single positive red; single positive green; and double positive (red and green). Dividing the cells into these four groups is called "quadrant analysis", since the results are typically displayed as a red vs. green "dot plot" divided into quadrants.
Below is an example of a dot-plot quadrant analysis for human blood lymphocytes.
